Syslog
Syslog is a logging standard for a range of sources, from the kernel to daemons to user space. It has its roots in networked environments, and today the protocol comprises a textual format defined in RFC 5424 and show in the picture below, along with deployment scenarios and security considerations.
 The Syslog format as defined in RFC 5424 has the following header fields (with
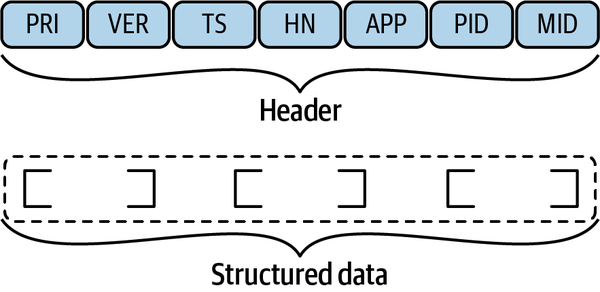
 TS and HN the most often used):
PRIthe message facility/severityVERThe Syslog protocol number (usually left out since it can only be 1)TSContains the time when the message was generated using ISO 8601 formatHNIdentifies the machine that sent the messageAPPIdentifies the application (or a device) that sent the messagePIDIdentifies the process that sent the messageMIDAn optional message ID
Typically one uses the syslog binary to take care of log management but over time improvements appeared, such as syslog-ng capable of storing logs in PostgresSQL or MongoDB and rsyslog that extends the Syslog protocol and can be used with systemd
Info
The syslog family of protocols and tools is still around and widely available, however with
systemdbecoming the de-facto standard of init systmes, most Linux distribution today have a better log: thesystemd journal
Journalctl and dmesg
systemd uses a binary format to store the log items. This allows faster access and better storage footprints. While one has to learn a new way to interact with logs when using journalctl, the learning curve is not too bad.
If you launch journalctl without parameters, it will present itself as an interactive pager. Useful options and arguments:
journalctl --since "3 hours ago" -- until "1 hour ago"journalctl --since "2021-09-26 15:30:00journalctl -f(Follow, like tail)journalctl -u abc.serviceRestricts to a single service
dmesg instead allows to display kernel ring buffer messages, logs events generated by the Linux kernel, like hardware issues, driver errors, or kernel-level crashes. It is useful for diagnosing low-level system problems.
Monitoring
uptimedisplay some basic system informationfreeprovides some memory statistics- virtual memory stats are available via
vmstat(vmstat 1updates every second) iostatshow I/O device metricsss -atpshows TCP sockets and processes that use them (-p)
Netstat
Netstat is now considered a deprecated tool, although it stilll works (see
netstat -ctulpn)
lsof also can help with, for example, one can use it in two ways:
- port/socket driven:
sudo lsof -i TCP:1-1024 - Process driven
lsof -p 5299
Besides the well known htop which is a top replacement, recently other tools started to appear in the monitoring space:
belowwhich has CGroups knowledgeglancesthat also covers devicesguiderthat has an integrated performance analyzerneossfor network traffic monitoringmtrfor network traffic monitoring
list
id:26
Advanced Observability
In the context of Linux, on a single machine, tracing means capturing the process execution (function calls in user space, syscalls, etc.) over time.
- We can trace functions in the Kernel using kernel probes or kernel tracepoints
- Application functions calls can be used as a source for tracing
Typically the information from this data sources is consumed using:
straceto trace the syscallperfto aggregate it (i.e. perf top aggregates by process)
Probes
A number of sources can be used for tracing: kernel probes in the Kernel, and user space probes in userland.
Kernel probes
Kernel probes (kprobes) are a debugging and performance analysis mechanism that allows developers to dynamically insert breakpoints within the Linux kernel code. Since the location of the Kernel in memory is randomized to enhance security (Kernel Address Space Layout Randomization or KASLR), probes are typically set using symbol-based addressing.
The kernel has a symbol table located at /proc/kallsyms that lists all kernels symbols and their addresses, and many tools like perf, bpftrace and SystemTap perform automatic resolution, so you can just specify the function name.
# log the filename argument every time it is open
sudo perf probe 'sys_open filename'
perf only support adding a logging handler on the prob, but using tools like bpftrace and SystemTap one can set up more complex handler for kernel probes
User probes
Since kernel and user space operate in separate memory address, it would be problematic to use a kernel probe to capture data about a user-space program. Additionally, there are security risk. For such a reason, a separate type of probes, user probes exists for user-space profiling
Tip
eBPF is becoming the de-facto standard for extending the Kernel and monitoring. For example, parca based on eBPF provides continuous profiling
A typical use case for tracing is profiling, i.e. identifying frequently called code sections. pprof, valgrind and Flame graphs are common lower-level tooling used in profilng, and many options existing to visualize perf output interactively
- TODO: add notes from https://www.markhansen.co.nz/profiler-uis/
- TODO: OpenMetrics vs OpenTelemetry